
If you live in Cumberland County and have kids in public schools, you certainly have strong feelings about whether they should return to the classroom. I’ve advocated for a return for several months. You may disagree, but I think everyone believes that the decision should be made on clear science. A flawed system may keep that from happening.
Our school board is currently laying the bureaucratic groundwork to keep our kids at home for the foreseeable future. Their tool: a system of metrics that measure the “covid risk level” in Cumberland County.
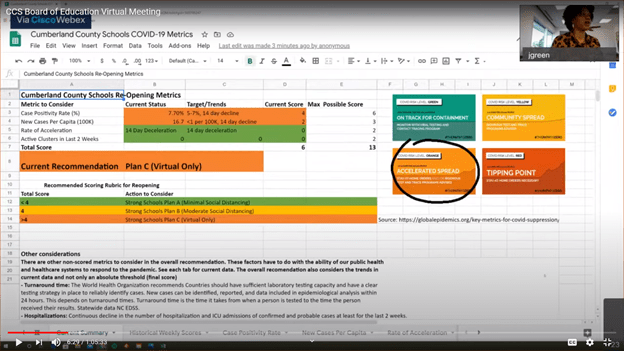
The above graphic is taken from a youtube video of the school board’s last virtual meeting. Many of these graphics are blurry screenshots. Apologies, I can’t find the actual charts online. You can watch the video below for clearer images:
The covid metric spreadsheet appears five minutes into the video. It seems that the county gets “points” for four covid metrics:
- Case positivity rate
- New cases per capita
- Rate of acceleration
- Active clusters in last 2 weeks
More points = More Covid. The maximum score is 13.
According to our county leaders, we should have a score of 4 or less before kids can go back to class. We’re currently at a score of 6.
Accelerated Spread?
A score of 6 puts us in the “Accelerated Spread” category (Orange).
But look closer. The “rate of acceleration” metric says “14 day deceleration.” It’s green.
So we’re in the “Accelerated Spread” category when our “rate of acceleration” is going down? This is absurd on its face. Covid can’t accelerate and decelerate at the same time. It exists in the universe and there are laws governing such things.

Positivity Rate Wrecking the Metrics
Looking closer, it appears that our phantom “acceleration” comes from our current positivity rate. We received 4 of our 6 points from this category alone. Skip to 16:00 in the youtube video to see how this works.
Under the current system, if Cumberland County’s positivity rate was below 6% (it’s currently 7.7%) we would get 2 points instead of 4, for a total score of 4 points. At 4 points, the “metric system” would recommend that our kids go back to school.
Making this worse is the fact that Cumberland County’s positivity rate jumps around. The reason is that the rate is entirely dependent on the number of tests that are analyzed on a given day. You can use the following link to see that we’ve been as low as 5% and as high as 15% within the past month.
https://covid19.ncdhhs.gov/dashboard/testing
What it Means
It’s entirely possible that our school board keeps school shut down based on a small percentage of one data point.
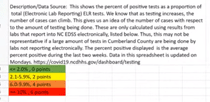
Since its the linchpin, we may as well read the data point’s “fine print”:
Description/Data Source: This shows the percent of positive tests as a proportion of total (Electronic Lab Reporting) ELR tests. We know that as testing increases, the number of cases can climb. This gives us an idea of the number of cases with respect to the amount of testing being done. These are only calculated using results from labs that report into NC EDSS electronically, listed below. Thus, this many not be representative if a large amount of tests in Cumberland County are being done by labs not reporting electronically. The percent positive displayed is the average percent positive during the last two weeks. Data in this spreadsheet is updated on Mondays. https:covid19nchdds.gov/dashboard/testing
It “may not be representative” but it “may be” the thing that keeps your kids from going to school. Welcome to 2020!

I think we need to find out if there’s a large number of tests in Cumberland County that aren’t being reported. If so, why are we even using this percentage in our decision making? You might as well pick a random number.
A Way Forward
If we’re going to open schools in Cumberland County, we’ve got to get a new system, or at least give less weight to the “percent positive” number that is admittedly based on incomplete data.
A cynic might say that Governor Cooper, NCDHHS, and County administrators set up these metrics with the goal of keeping schools closed. I’m not quite there yet, but if they don’t fix it, I will be.
Here’s one solution: from the very beginning, we have been told that we needed to “shut down” in order to “slow the spread” and avoid overwhelming our health care system. Remember that? What happened that that data point? Fortunately, it’s still being monitored:
If you go to 36:00 minutes in the video, you will hear Michael Nagowski, the head of Cape Fear Valley Hospital. He notes that the number of covid patients has been cut in half since the peak of the pandemic. He says there are twenty eight people at the medical center that are “also covid positive.” The peak was fifty-seven.
This is consistent with (if not better than) the trend across the state:

The number of individuals hospitalized in Cumberland County for covid should carry as much, if not more weight, than the percentage of positive tests. Hospitalizations are not dependent on the number of tests given or the number of labs electronically reporting results to the state. In fact, hospitalizations, apart from deaths, are the best way to determine the severity of the pandemic in this community. There is no “fine print.”
Last Analysis
These types of formulas are wonderful for elected officials. Our leaders can sit back and point to a graph or chart and avoid making a difficult decision themselves. It’s the definition of political “cover.” The problem is that once you get in the weeds, you find that the cover is often a smokescreen.
Remember that the ultimate decision rests with your elected officials, not some contradictory color-coded chart on a blurry youtube video. Hold them accountable.
Our kids deserve real school.
Our kids deserve real science.
Spread the word. We can make that happen.

Our kids deserve continuity of learning until we have a vaccine! Watch the private schools! If you start in person then have to shut down per an infection where is the continuity? I totally agree that online school is not optimal but please consider the continuity piece of the situation . I do not have a dog in this fight currently but still have a tremendous love for public education and what is best for our children! Look at the whole picture for the children and not for politics!
LikeLike
Color me impressed! And I do not extend that lightly. For the first time in years, yes years this is an amazing, well though out, well put together piece of journalism. Thank you.. I do have 2 children in school in the Terry Sanford District and I very much appreciate this information.
LikeLike
Thank you. That’s very high praise.
LikeLike